


The System Strategy is trading based on the 10 SMA and 50 SMA moving average crossover on the higher timeframe 30min and hourly charts.
It was created by @TraderBJones.
Regardless of your trading style, The System allows you to have a higher macro direction in mind while you trade on your shorter 5m or 1m timeframes. When all timeframes line up in direction, you get a powerful A+ strategy.
How to Trade The System Strategy
BUY/SELL SIGNAL - 10/50 SMA CROSSOVERS
If the 10/50 SMA is bearish on the 30m chart, you have a SHORT thirty signal. If bullish, you have a LONG signal.
If the 10/50 SMA is bearish on the hourly chart, you have a SHORT hourly signal. If bullish, you have a LONG signal.
As these are based on longer timeframes, once you get The Signal, you want to find optimal entries on the shorter time frame charts to base your entries in the direction of the larger timeframe trend.
THE CHOP ZONE
If price is trading between the 10SMA and 50SMA levels on the 30min chart, then this is considered a chop zone, and trades should be avoided or sized much smaller as direction is uncertain.
CONVICTION
The strongest signals are when both the 30m and hourly charts are telling the same story.
GETTING OVER EXTENDED
Once we get a 100 point move in our direction away from the 50 SMA, we are consided in extended territory and expect pullbacks. While we still have LONG signal, you may consider buying these dips until the trend changes again.
THE REVERSAL
If we currently are in a BUY signal, but the price action breaks below the 50 SMA, then you have an indication of the bears regaining control. This will bring the SMA’s back together and create an eventual SELL signal. You can trade to get ahead of the official SELL signal by trading a SHORT position when we break the 50 SMA on the 30m chart.
The opposite can be played in the inverse setup, where we may have a SELL signal, but then go LONG if we break through and start trading above the 50 SMA.
Once we get the reversal into the 50SMA, we should start to buy/sell the pullbacks in anticipation of the EMA crossover occurring and a new signal being announced.
BASIC SETUP
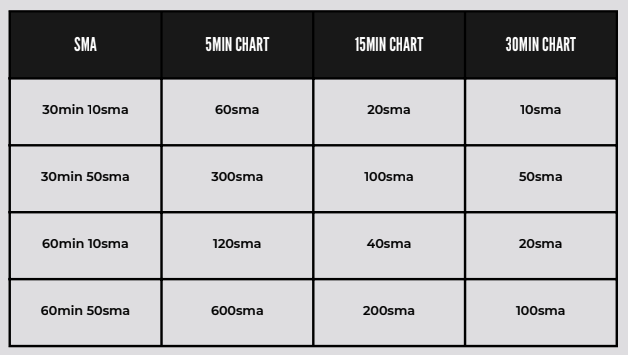
One way we like to trade the System SMAs is to map them over to lower time frames to help improve with our entries. The following table outlines how to map the System SMA’s onto a 5 minute chart. Remember to use Regular Hours as The System is not designed to take Extended Hours into account for its strategy.
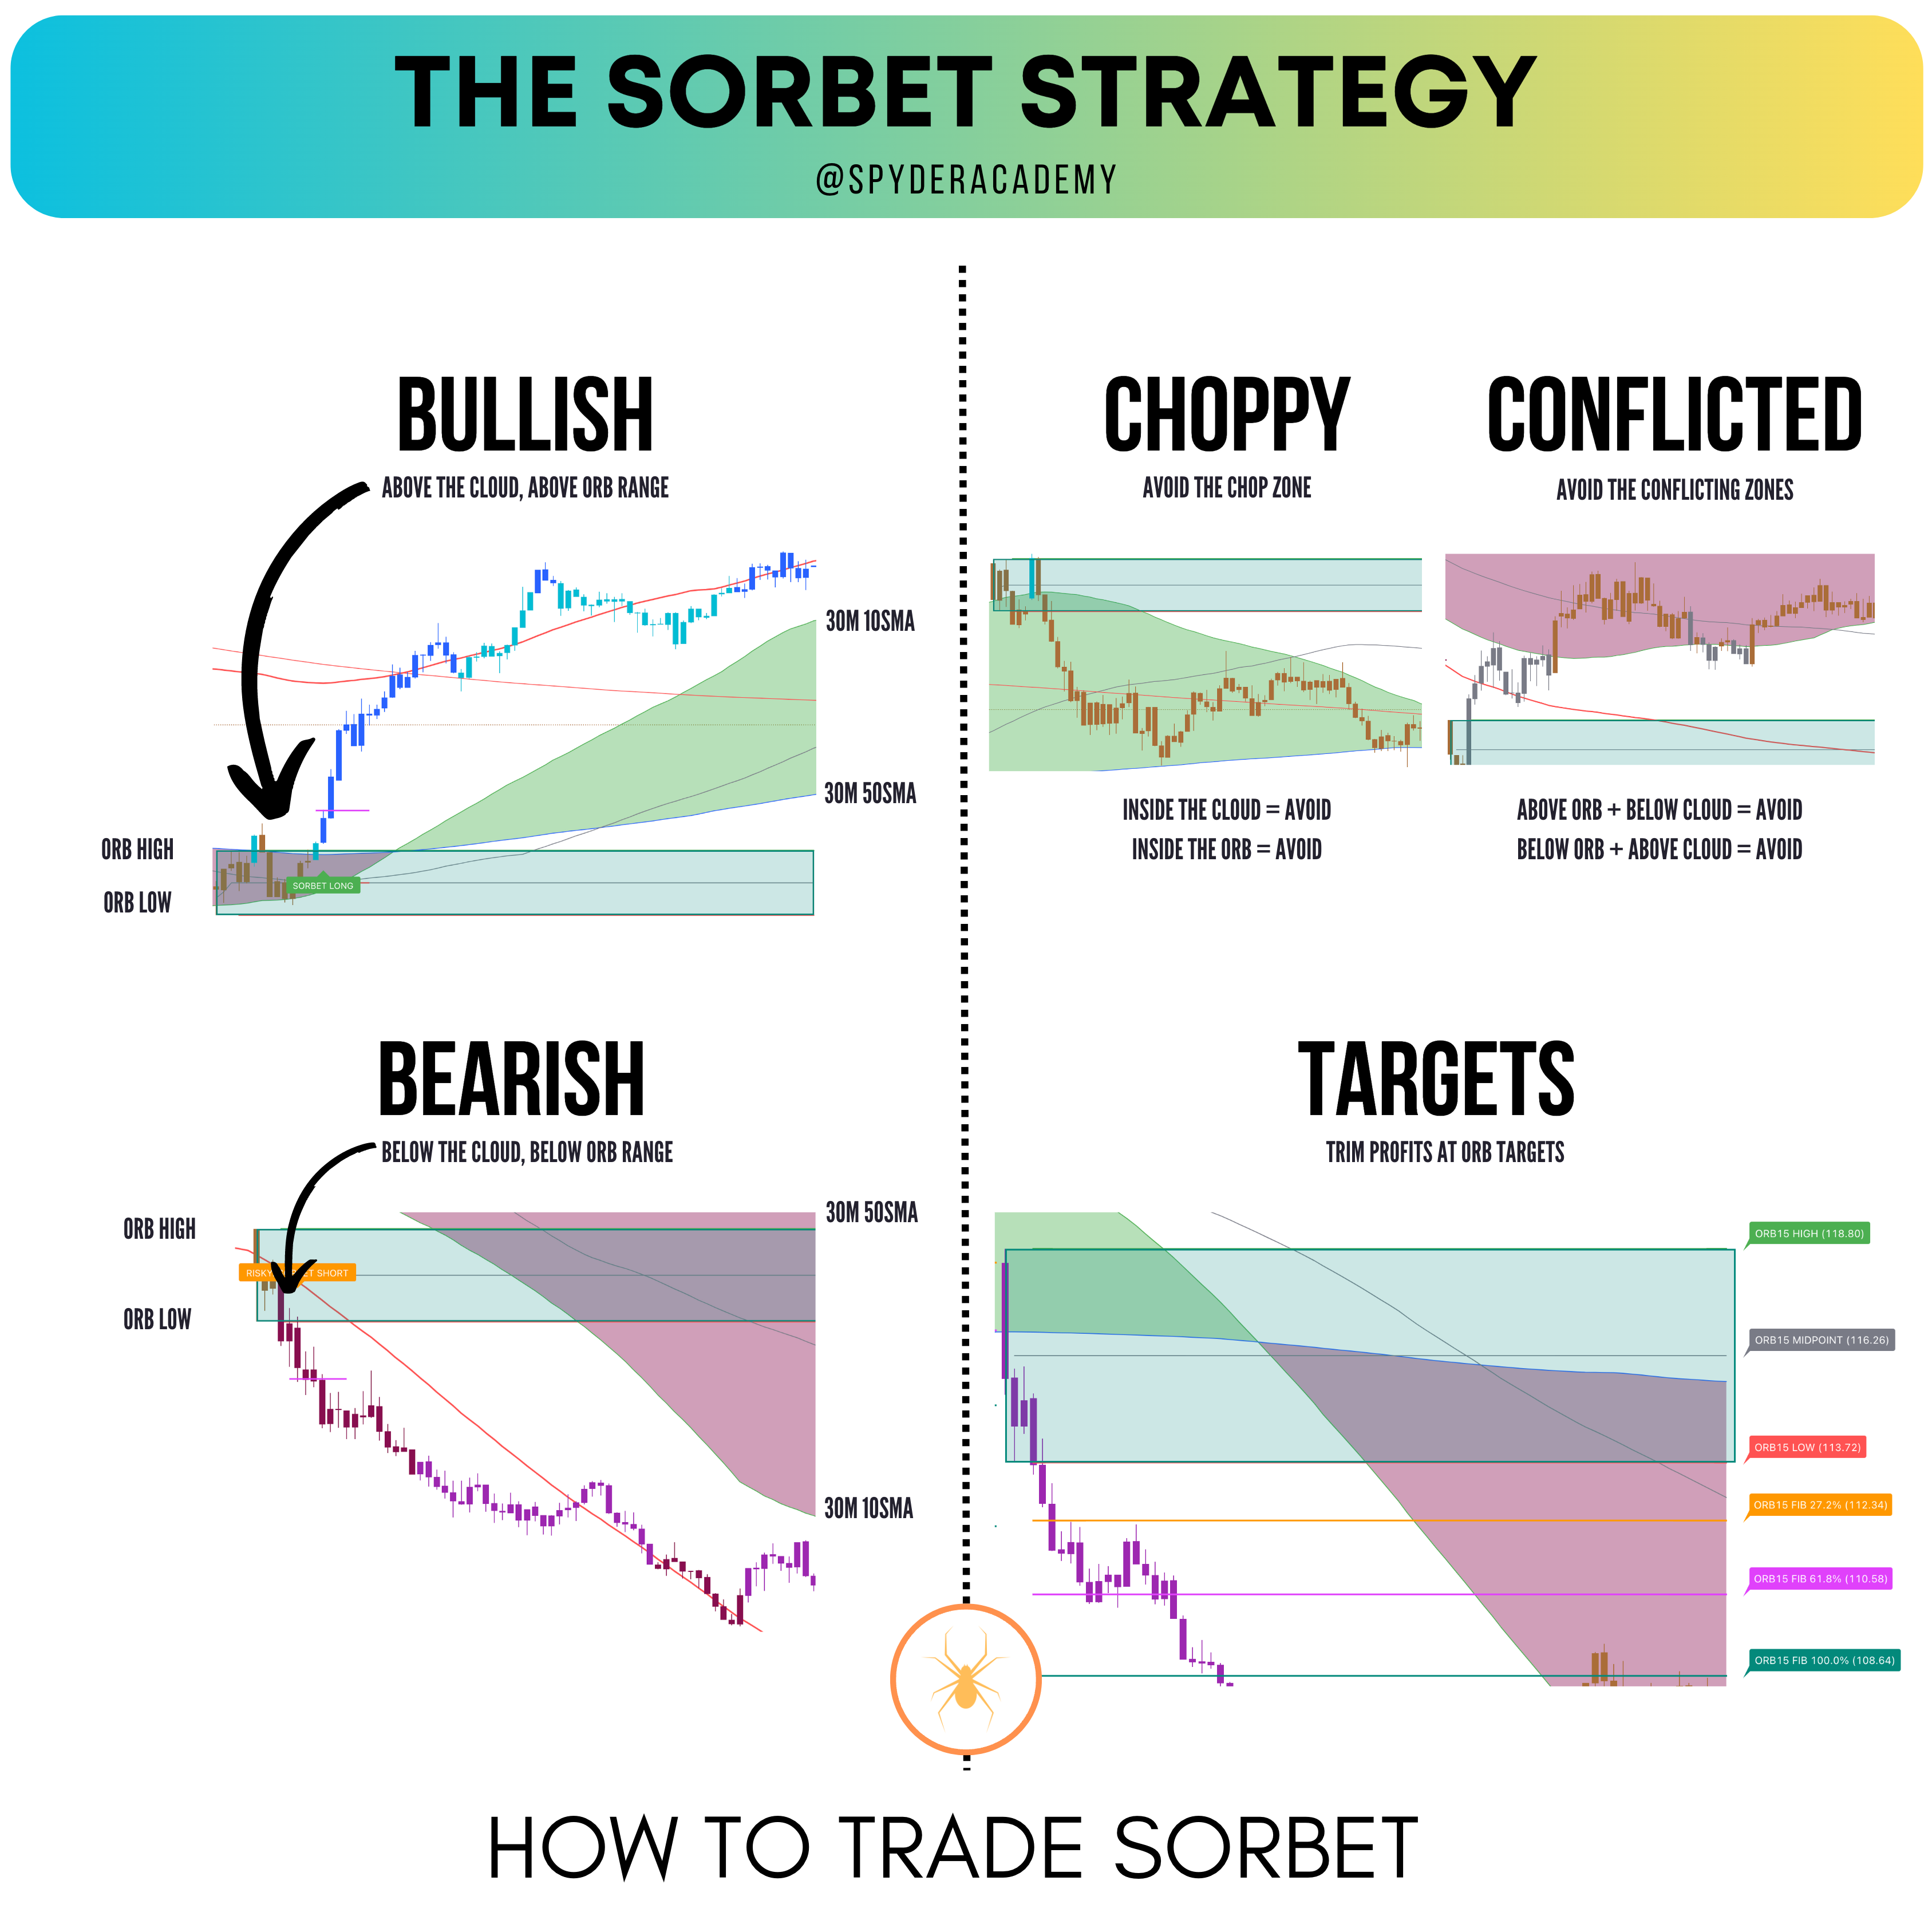
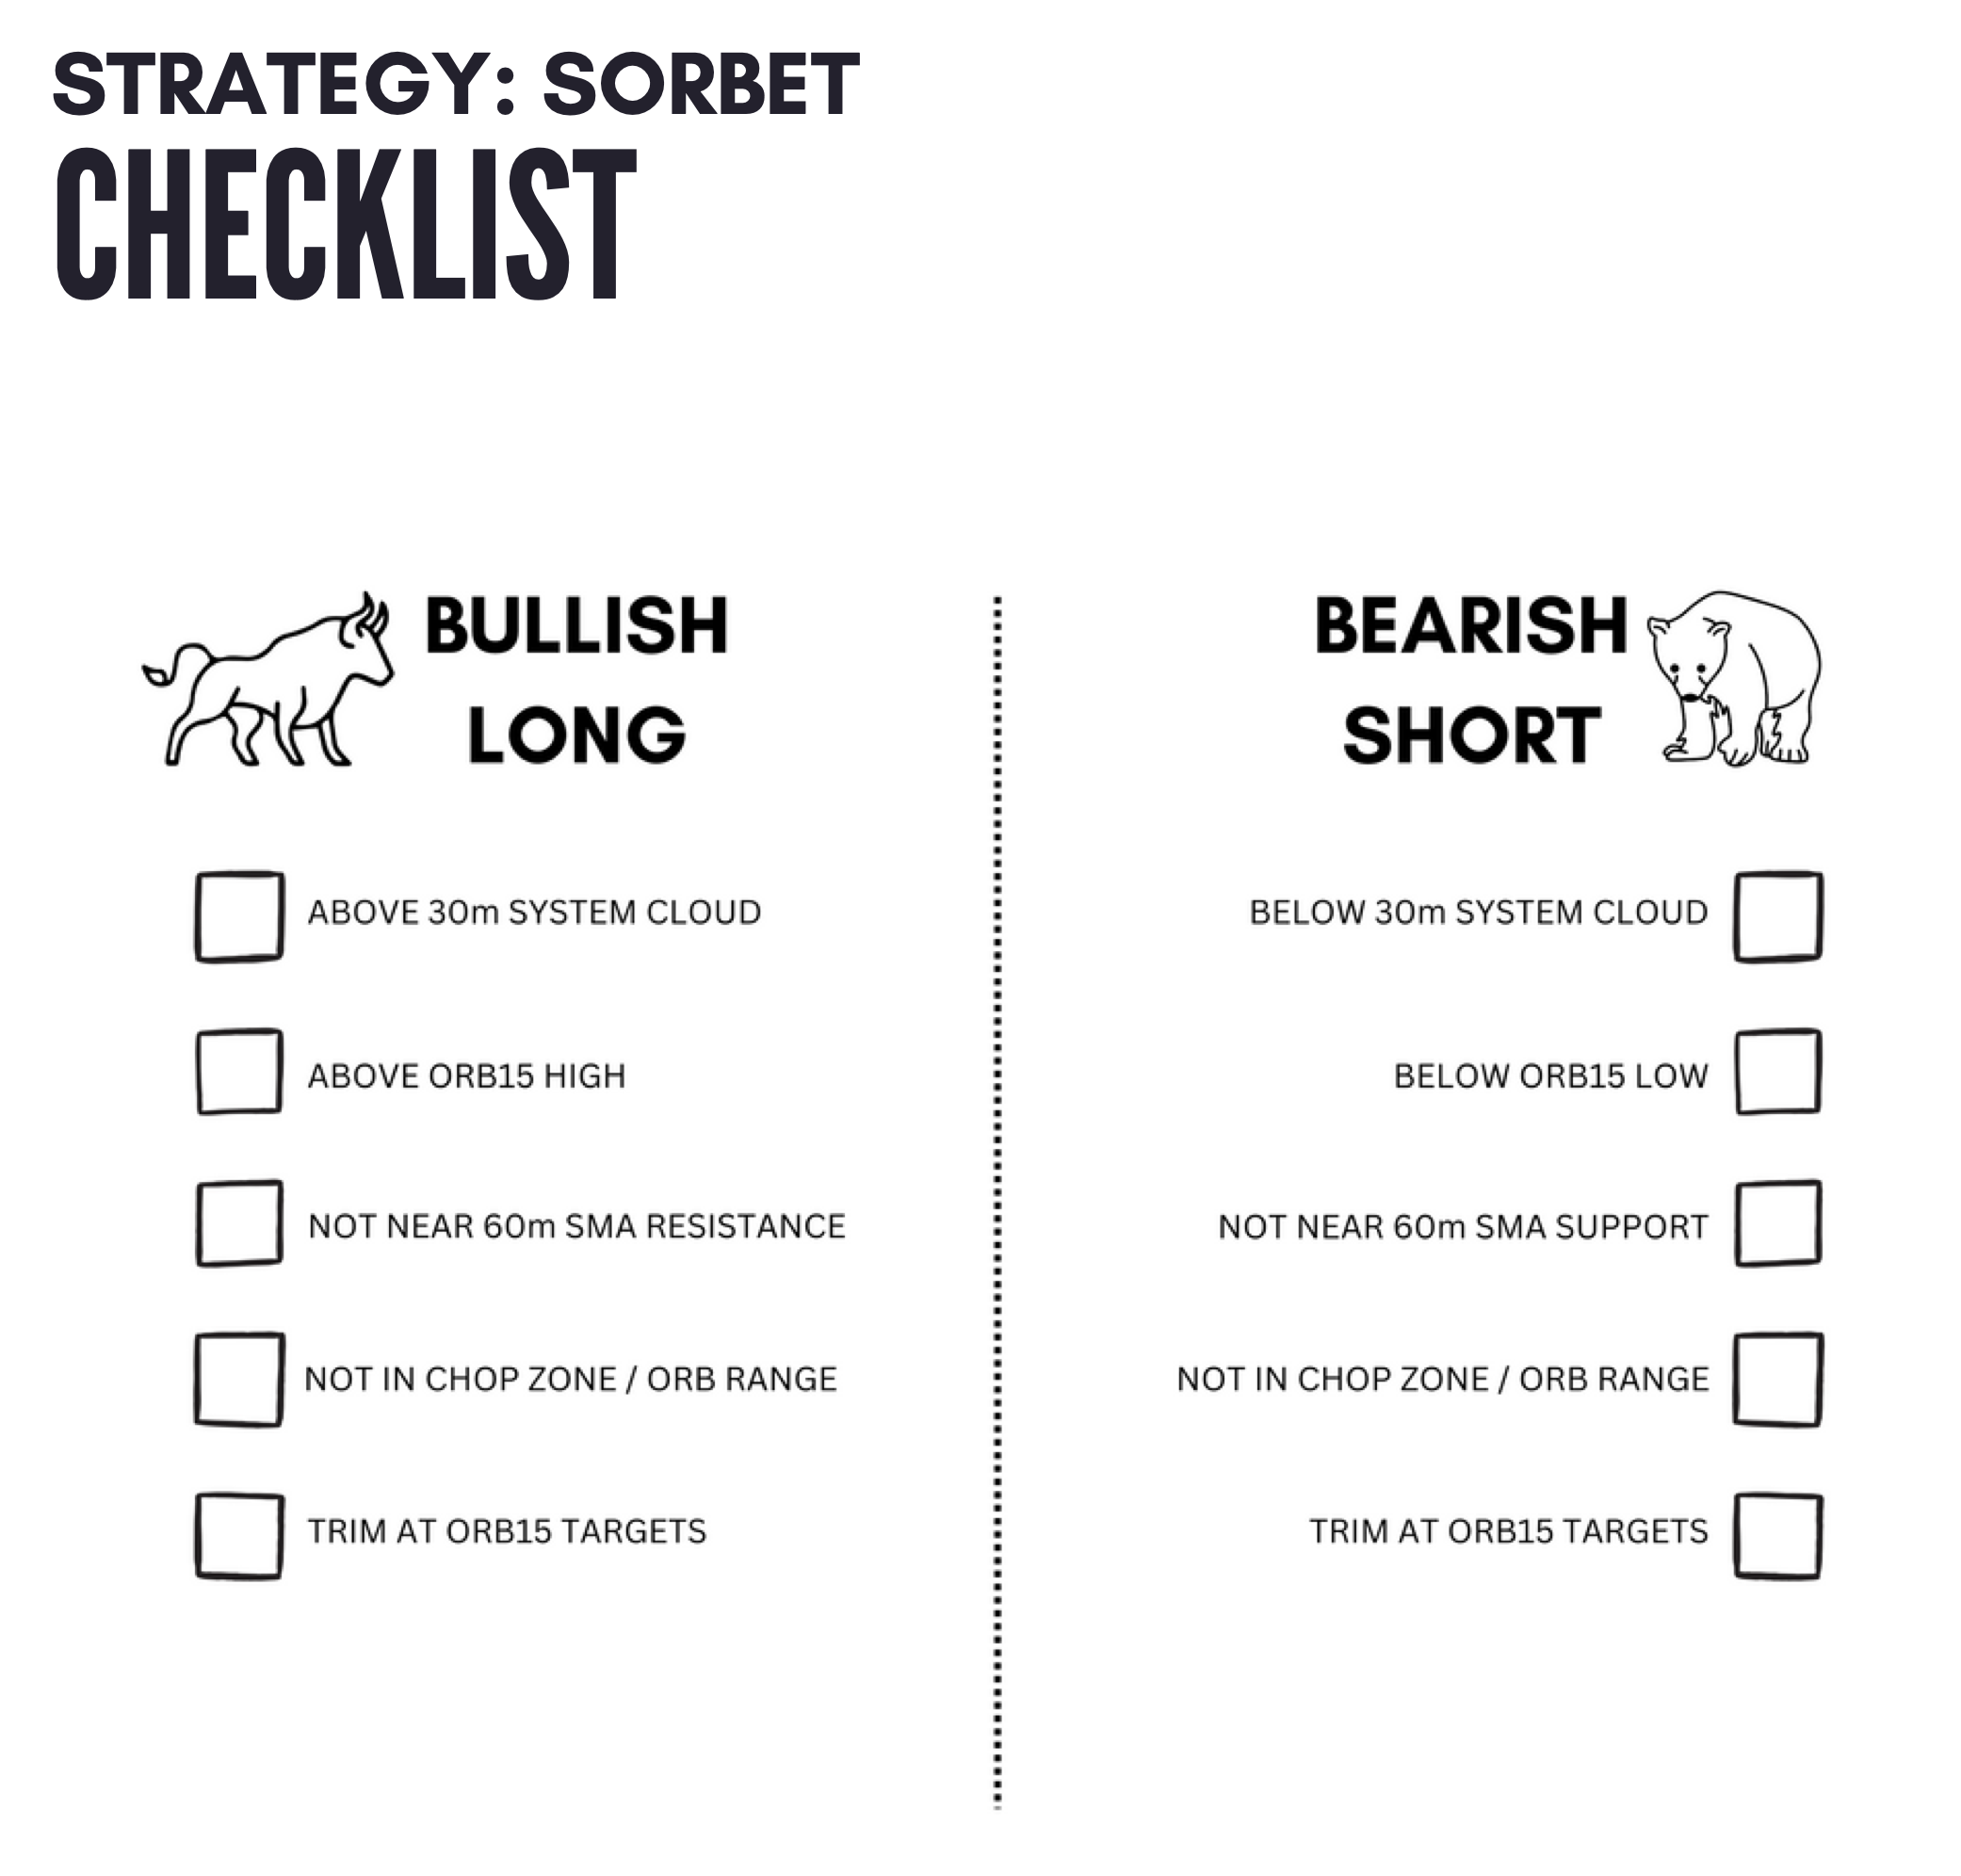
SORBET - THE SYSTEM + ORB ENTRY POINTS
The SORBET strategy combines my two favorite techniques - ORB and The System. Learn more about the Opening Range Breakout strategy to find Entries and Exits. By combining these two strategies, you can reduce the amount of fakeouts by determine the larger timeframe bias given by The System, with optimal day trading entries and exits using ORB.
MORE EDUCATION
Please start by learning from the original document on The System below, taught free by its creator TraderBJones