

Discover the secret sauce of successful traders with our comprehensive guide on unlocking the power of Bollinger Bands. Whether you’re a seasoned pro or just starting out in the world of trading, learning how to use Bollinger Bands in trading can provide you with the edge you need to maximize your potential.
In this guide, we’ll dive deep into what Bollinger Bands are and how they work. We’ll explore how to interpret the signals they generate and provide you with a step-by-step approach to incorporating Bollinger Bands into your trading strategy. With their ability to highlight price volatility and potential trend reversals, Bollinger Bands have long been a favorite tool of professional traders. By understanding their intricacies and learning how to harness their power, you can gain a significant advantage in the markets.
Join us as we unlock the potential of Bollinger Bands and help you take your trading game to the next level using effective Bollinger Bands trading strategies.
Don’t miss out on this opportunity to enhance your skills and improve your trading results. Get ready to revolutionize your approach to trading with Bollinger Bands.
What are Bollinger Bands?
Bollinger Bands are a popular technical indicator used by traders to identify potential buying and selling opportunities in the market. Developed by John Bollinger in the 1980s, Bollinger Bands consist of three components: the middle band (typically a simple moving average), an upper band representing two standard deviations above the middle band, and a lower band two standard deviations below. These bands dynamically adjust to market volatility, providing a visual representation of price volatility.
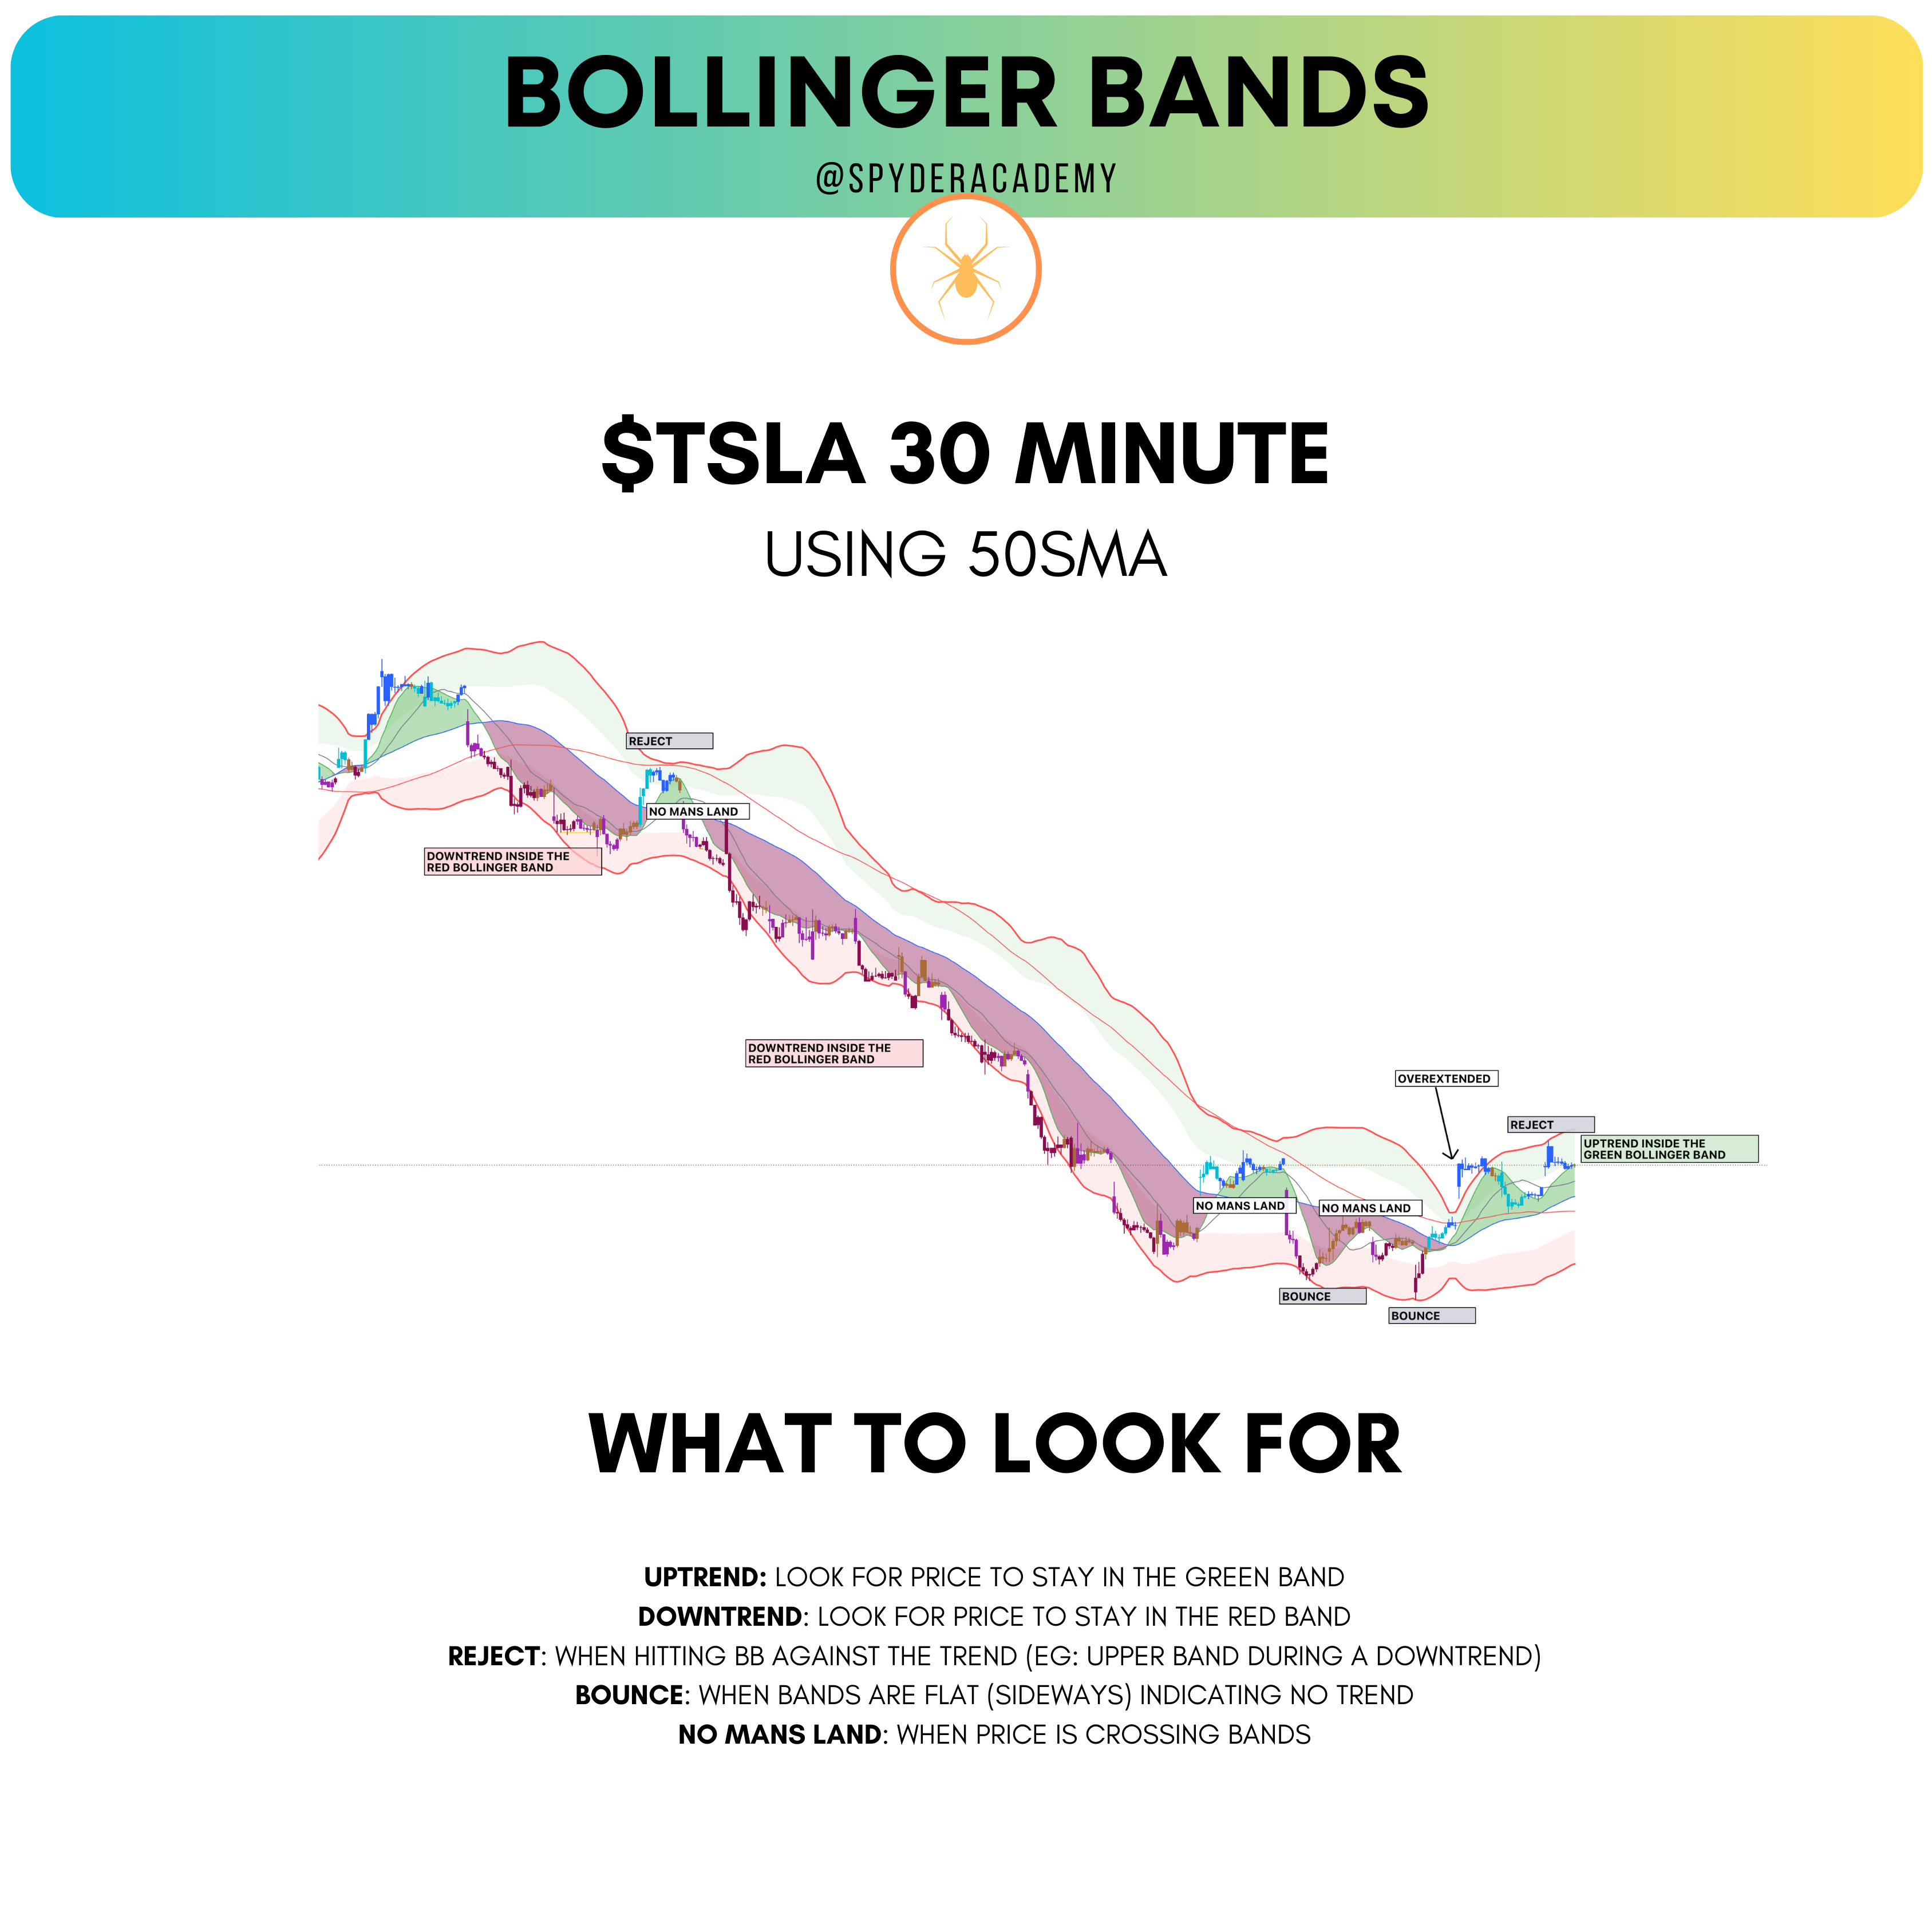
Understanding the foundation of Bollinger Bands is the first step in mastering how to trade using Bollinger Bands effectively. When trading The System + ORB strategies together (SORBET), I have been using the 50-day simple moving average (SMA) on the 30 minute chart from The System to determine my Bollinger Bands.
You can use it similar to how we treat the 100 point extended line on SPX using The System where we say its time to take profits.
How to Calculate Bollinger Bands
- Middle Band (MB): Calculate the n-period simple moving average.
- Upper Band (UB): MB + (2 * standard deviation of price over the same period).
- Lower Band (LB): MB - (2 * standard deviation of price over the same period).
Interpreting Bollinger Bands - Volatility and Trend Identification
- Volatility: Wider bands indicate higher volatility, while narrower bands suggest lower volatility.
- Trend Identification: When prices touch or exceed the upper band, it may signal overbought conditions; touching or falling below the lower band may indicate oversold conditions.
Bollinger Bands Trading Strategies: How to Trade Using Bollinger Bands
- Bollinger Squeeze: A period of low volatility often precedes a significant price movement.
- Bollinger Breakout: Trade on a breakout when prices breach the upper or lower bands.
- Mean Reversion: Anticipate a return to the mean when prices extend beyond the bands.
Practical Application: How to Use Bollinger Bands to Trade
Incorporate specific examples or step-by-step processes demonstrating the application of Bollinger Bands in trading scenarios.
IDENTIFYING OVERBOUGHT / OVERSOLD
When using Bollinger Bands, it’s important to keep in mind that the market tends to stay within the boundaries of the 1 standard deviation line and the 2 standard deviation line. This means that when price is trading between the two lines, it’s considered to be in a “normal” state.
TRADING THE TREND
One strategy for trading with Bollinger Bands is to look for buying opportunities when price is trading near the lower band and selling opportunities when price is trading near the upper band.
OUTSIDE THE BANDS
When price breaks outside of the bands, it’s a sign that the market is either unusually bullish or bearish.
HOW TO SET UP YOUR CHART
If using TradingView, you can add their stock Bollinger Band indicator. By default, traders use the 20sma on their timeframe for their length field to get a good average to work with.
Using The System 50sma as your Bollinger Band Settings
Set the length field to 50 to use the 50sma on a 30 minute chart.
Advanced Bollinger Bands Techniques - Using Multiple Timeframes and Indicators
- Multiple Timeframes: Combine signals from different timeframes for confirmation.
- Additional Indicators: Enhance analysis by incorporating complementary indicators like RSI or MACD.
Common Mistakes to Avoid When Using Bollinger Bands
- Ignoring Market Conditions: Consider the broader market context.
- Overlooking Confirmation Signals: Use additional indicators to confirm Bollinger Bands signals.
- Neglecting Risk Management: Implement robust risk management strategies.
Bollinger Bands in Different Markets - Stocks, Forex, and Cryptocurrencies
- Stocks: Apply Bollinger Bands to identify potential trend reversals or breakouts.
- Forex: Use Bollinger Bands to gauge volatility and identify entry/exit points.
- Cryptocurrencies: Adapt Bollinger Bands strategies to the unique characteristics of the crypto market.
Conclusion - Harnessing the Power of Bollinger Bands for Successful Trading
Bollinger Bands, with their versatility and adaptability, empower traders to navigate the complexities of various markets. By understanding their components, interpreting signals, and employing strategic trading approaches, traders can harness the power of Bollinger Bands to make informed and successful trading decisions. Integrating risk management and continually refining strategies contribute to sustainable trading success.