Hey traders! 👋 Ready to uncover another powerful duo in the world of trading? Today, we’re shedding light on the mysterious Double Tops and Double Bottoms – also known as Tweezer Tops and Tweezer Bottoms. Get ready for a ride through the highs and lows of the market!
What’s the Buzz About?
Double Tops and Double Bottoms are like the dynamic duo of trend reversal patterns. They signal potential shifts in market direction, offering traders a heads-up for strategic moves. Picture it like a two-act play – you’ve got two peaks (Double Tops) or two troughs (Double Bottoms) standing out in the price action.
How to Spot Them?
-
Double Tops:
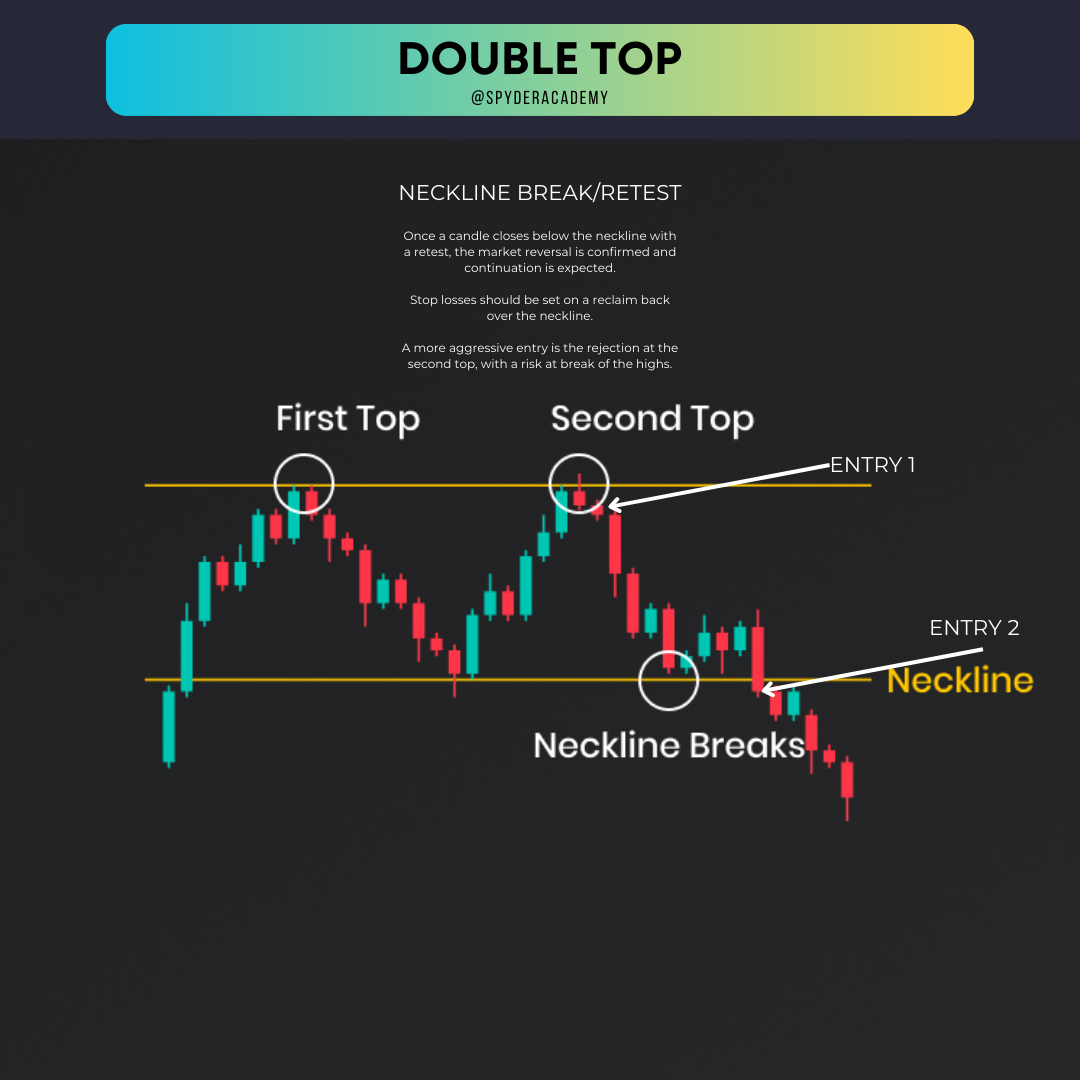
- Act one begins with an uptrend. The first peak forms as prices reach a high, then pull back. The market rallies again, creating the second peak, but can’t surpass the first. It’s like a market tug-of-war – bears stepping up!
-
Double Bottoms:
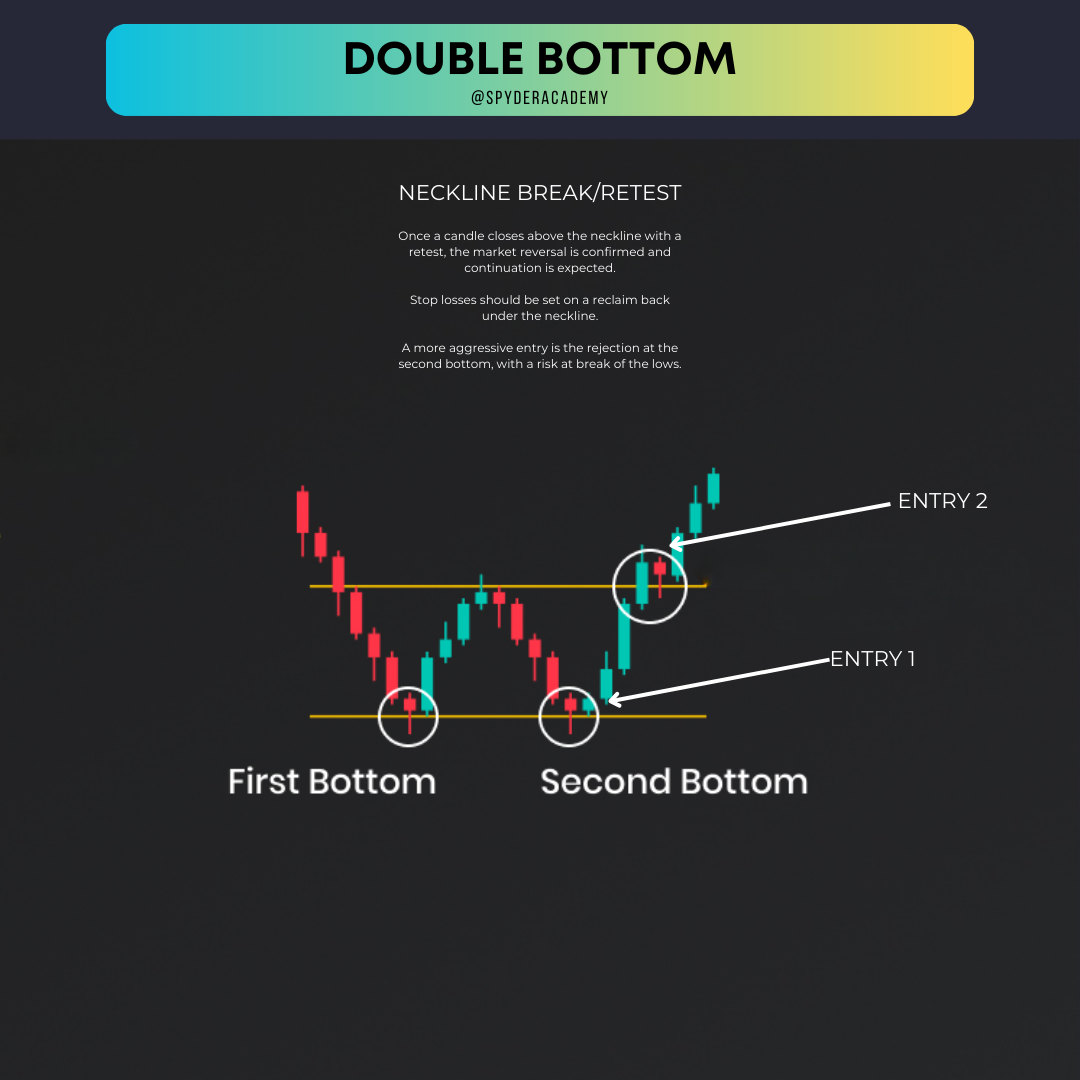
- Cue act two with a downtrend. The first low point forms, followed by a bounce. The market slips again, forming the second low, but doesn’t break the first. Bulls are putting up a fight!
Why Should You Care?
When the neckline (the line connecting the lows for Double Tops or highs for Double Bottoms) breaks, it’s showtime! A break below signals a potential bearish reversal, while a break above screams bullish vibes.
Let’s Break It Down with Examples:
Example 1: Bearish Double Tops

In this scenario, we witness a classic Double Tops setup. The market rallies twice but fails to break the initial peak’s height. When the neckline (red line) breaks, it’s the bears taking center stage.
Example 2: Bullish Double Bottoms

Now, flip the script! Double Bottoms indicate a potential bullish reversal. The market slips twice but fails to break the initial low. Breakthrough! When the neckline (green line) is breached upwards, it’s time for the bulls to shine.
Tips for Trading Like a Pro:
-
Confirm the Break:
- Wait for that neckline to break before making your move. Patience pays off.
-
Volume Matters:
- Keep an eye on trading volumes. A breakout with high volume adds weight to the pattern.
-
Risk Management is Key:
- Set clear profit targets and protective stop-loss levels. Risk wisely to ride the waves.
Wrapping Up:
And there you have it – Double Tops and Double Bottoms demystified! They’re your partners in crime for spotting trend reversals. Remember, practice makes perfect, so go ahead and dive into the charts. Happy trading, legends! 🚀💸


