In our comprehensive educational section, we delved into How to Trade using Gamma Exposure (GEX) — unveiling its significance and the benefits it brings to traders.
Look up the Gamma Exposure with our Free Tool
Navigating the Net Gamma Exposure Chart:
Traders can harness the capabilities of the Net Gamma Exposure tool on the Spyder Academy platform to gain insights into near real-time gamma positioning. This tool provides a profound understanding of structural flows, offering invaluable insights into the market’s current state and potential future movements.
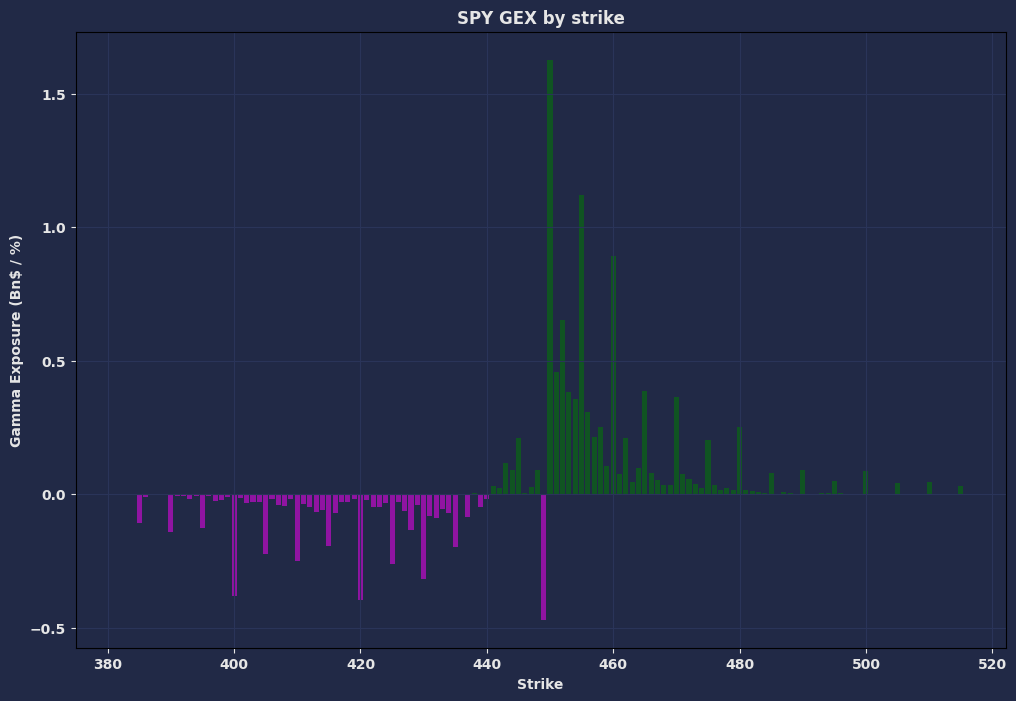
This chart visually represents the Net Gamma Exposure for all options contracts related to SPY at the current moment. The GREEN bars signify NET CALL GAMMA, indicating a bullish stance, while the magenta bars represent NET PUT GAMMA, signaling a bearish outlook.
Call Gamma suggests that most market participants have positions moving toward that specific price level, while Put Gamma implies a desire among market participants to drive the underlying price down to that level.
Consequently, these Gamma Levels often act as influential magnets for price movement.
Gamma Exposure Overlay
Taking a closer look at the chart above, we observe that the highest gamma levels align with $450 for SPY. As we move away from this price, gamma levels diminish, and put gamma starts to rise below that threshold.
Essentially, the underlying price tends to gravitate towards the $450 level, guided by the strategic positions of major market makers.
Now, let’s superimpose the Gamma Exposure levels onto the stock chart for SPY:
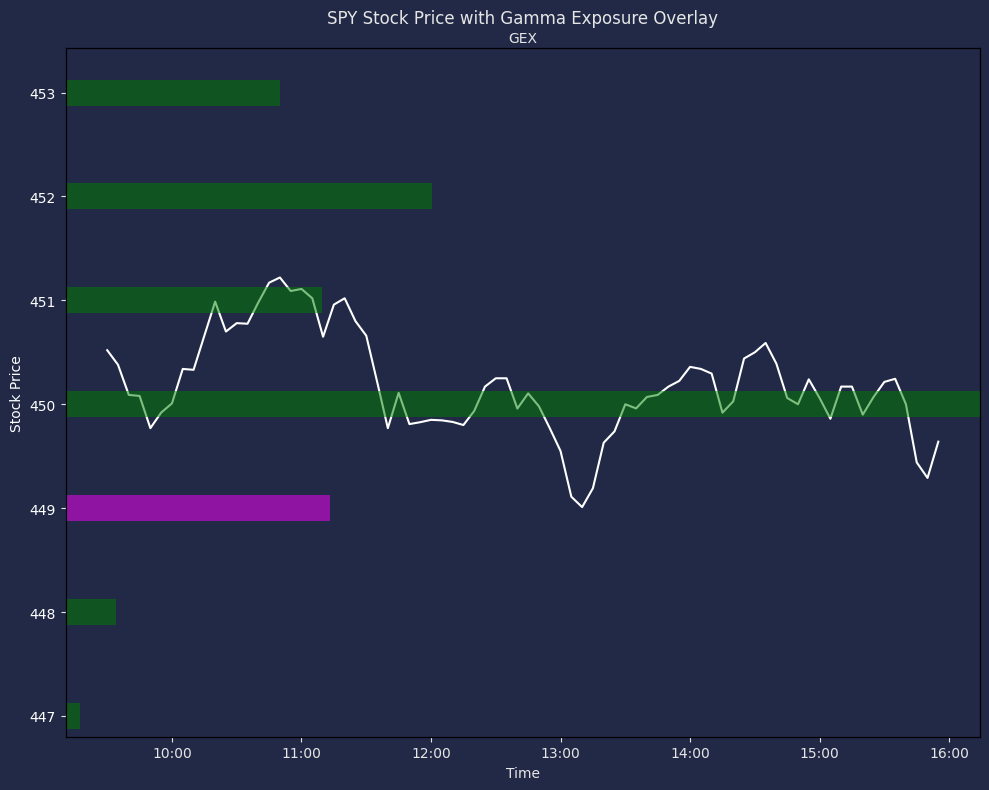
In this overlay, the SPY underlying price initially opens above the $450 level, then descends to it before rebounding near that point. The $451 strike price serves as resistance, initiating a subsequent move back towards $450, where consolidation takes place.
While the largest Gamma Exposure levels act as magnetic forces, influencing the price movement, it’s essential to note that this isn’t a guaranteed outcome. External factors, such as unexpected news events, can override these influences and push the stock price in the opposite direction. In such instances, the Open Interest on these contracts might rapidly decrease as market participants aggressively exit their positions.
However, if the price does start gravitating towards the prominent GEX levels, these levels can serve as potential targets for the entire move.
Traders may consider adjusting their positions along the way to capitalize on the journey towards the magnetic level.
How to Get the Gamma Exposure Chart in Discord
In the Spyder Academy Discord Classroom, simply type /gex chart TICKER, replacing TICKER with the specific ticker you are analyzing.
For instance, entering /gex chart SPY will generate the following chart for SPY as of Nov 15, 2023: